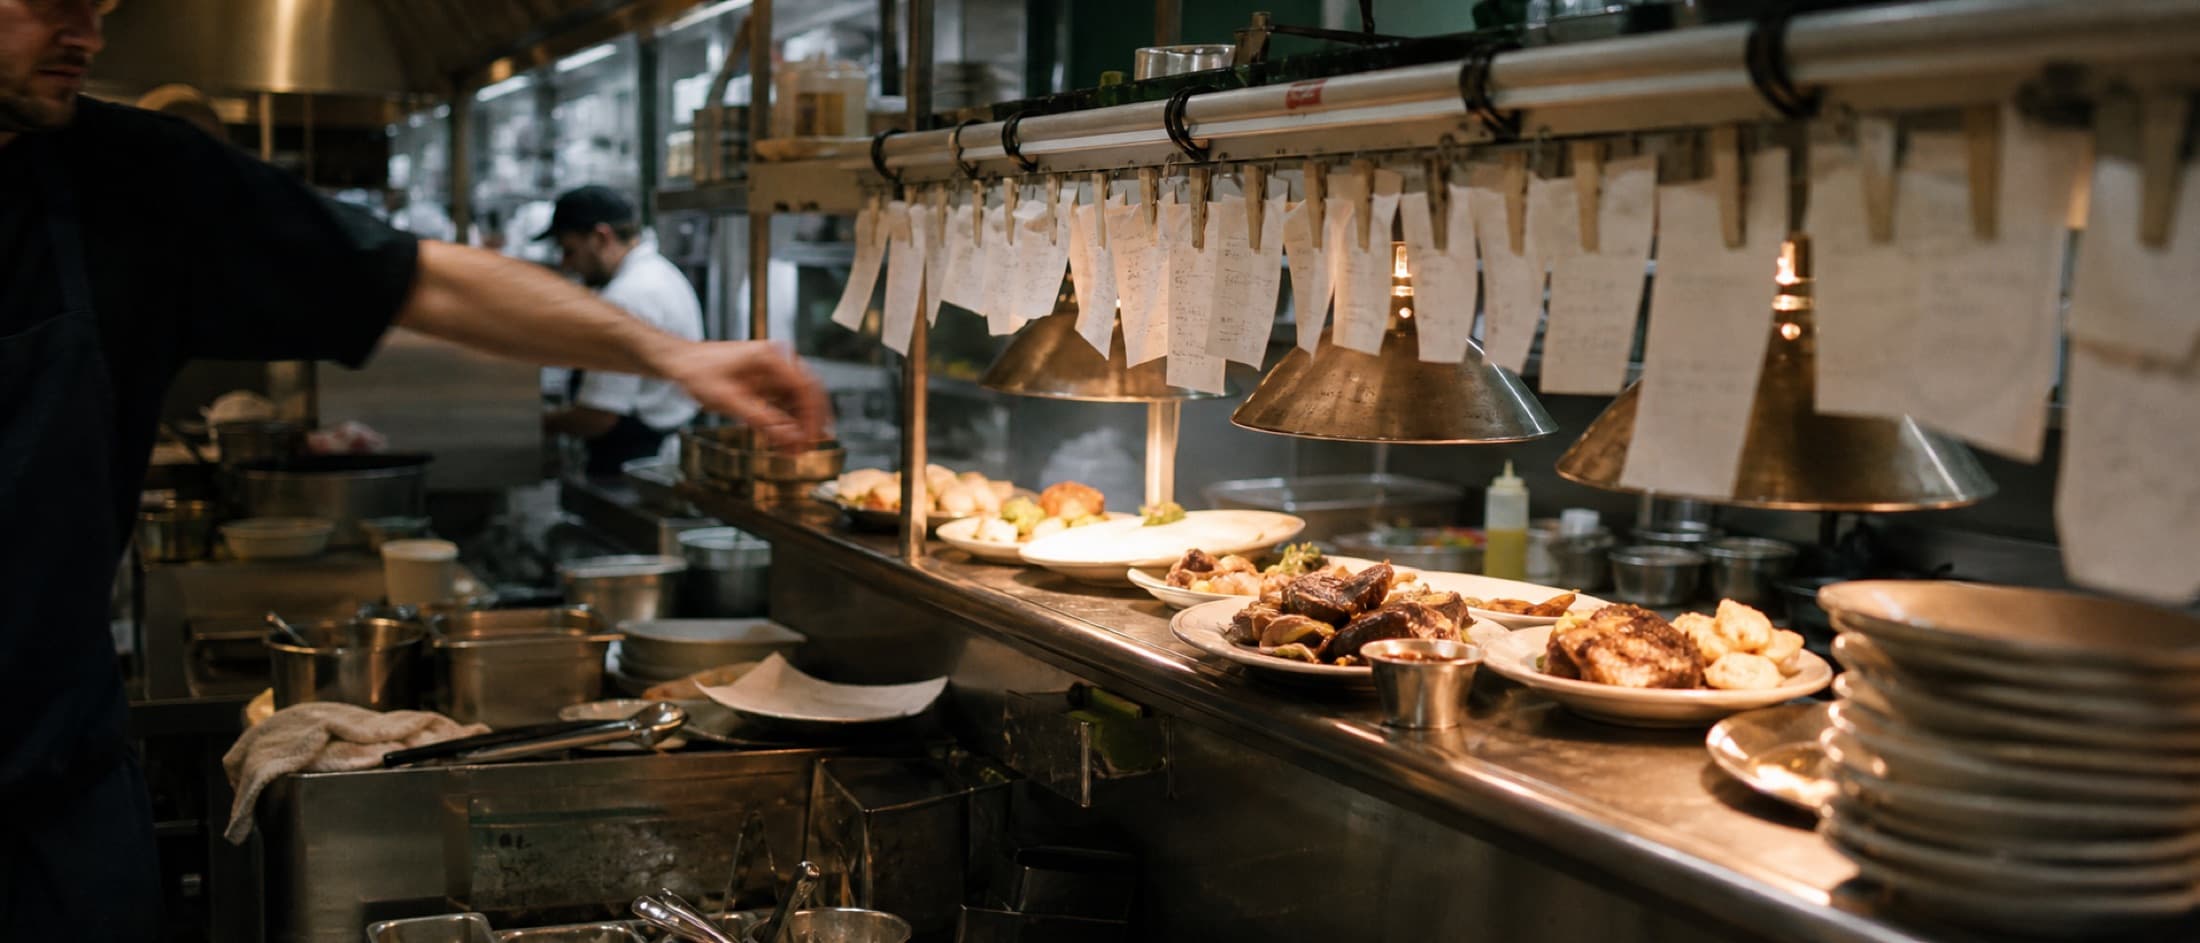
The pass
I built these for my own stores first.
Before any of this was for sale, I was a district manager with the same problems you have. These three tools are what I made to stop doing the work by hand across 50+ stores.
They are also the honest answer to whether I can actually do this, which matters more than anything else on this site.
One · Food cost variance
Not that cost moved. What moved it
Theoretical versus actual usage per item, built from unit pricing and what the POS says you sold. Instead of finding out your food cost moved, you find out that avocado moved it — by $389 in the sample below, for the third week running.
Anything flagged three weeks straight is a process problem rather than a bad count, and it's a different conversation. Knowing which one you're having is most of the job.
This one runs. Two taps and it rebuilds itself for a house your size. Nothing you tap or type leaves your browser.
Pick both and the seven lines below rebuild at that scale.
These 7 lines: $705.85 used over · $376.35 net of credits · 3 to investigate, 1 elevated
| Item | Unit | Begin | Purch | End | Theo. use | Actual use | Variance $ | Flag |
|---|---|---|---|---|---|---|---|---|
| Beef, top sirloin prep | BAG | 65.6 | +214.39 | Investigate | ||||
| Shrimp, raw peeled | BAG | 31 | +1.90 | |||||
| Avocado, 48ct | CASE | 14.1 | +388.57 | Investigate · 3 wks | ||||
| Chicken, boneless thigh | BAG | 196.4 | -27.40 | |||||
| Crab, snow cluster | CASE | 0.8 | -302.10 | Investigate · 3 wks | ||||
| Broccoli, floret | BAG | 15.3 | +96.19 | Elevated | ||||
| Salmon, 4oz portion | CASE | 9.1 | +4.80 |
Flagged at $150 to investigate, $50 elevated — the thresholds move with the size of the operation, because a $150 gap is a morning’s work at one restaurant and a rounding error across thirty. In dollars rather than percent, because a fifth of the parsley is not worth anyone’s morning and two percent of the sirloin is. Under-use counts too: it usually means a miscount or a recipe that no longer matches the kitchen.
Two · Punch exceptions
What went wrong on yesterday's punches
Every morning it reads yesterday's punches against the schedule and surfaces only what is wrong. Somebody 40 minutes past their scheduled out. A nine-hour shift with an 18-minute break. A manager who never clocked in at all. An 8:00 AM shift punched at 7:58 PM, which is always a mistake and never once a person.
The point is not the list. The point is that nobody reads 23 stores of raw punch data, so nobody used to catch any of it until payroll closed and it was too late to fix.
61 exceptions across 18 stores · 44 at risk of OT · 5 of 23 stores all clear
- Over scheduledR. Delgado clocked out 41 min past scheduled end (2:41 PM vs 2:00 PM)
- Break policyS. Whitcombe worked 7.4h with 0 min break (policy: 30)
- Break policyA. Nakamura worked 9.8h with 18 min break (policy: 30)
- No clock-inK. Osei (manager) was scheduled 1:00 PM but never clocked in
- Late out 15-29mM. Barrantes clocked out 22 min past scheduled end (10:22 PM vs 10:00 PM)
- AM/PM mix-upT. Okafor clocked in 7:58 PM but was scheduled 8:00 AM (12.0h apart, check AM/PM)
- Training mismatchJ. Prieto was scheduled as training but clocked in as regular
- Over scheduledL. Fairweather clocked out 58 min past scheduled end (11:58 PM vs 11:00 PM)
- Break policyD. Mensah worked 6.6h with 0 min break (policy: 30)
Three · The morning read
Every store on one page, before you open
Sales, labor, speed and accuracy for every store and district, pulled automatically each morning rather than assembled by hand. It refreshes on its own, which is the only reason anybody actually looks at it.
This is the one that replaced the Monday report somebody used to rebuild every week. The hours it gave back are the specific hours I mean when I talk about hours.
| District | Sales | Mix | Sales var | Hrs var | Labor % | SPLH | Txns |
|---|---|---|---|---|---|---|---|
| North District | $34,910 | 24.6% | +$5,180 | +3.2 | 25.4% | $102.40 | 2,588 |
| South District | $28,150 | 19.8% | +$1,220 | -6.4 | 22.1% | $98.70 | 2,004 |
| East District | $21,470 | 15.1% | -$640 | -9.1 | 27.8% | $88.30 | 1,612 |
| West District | $26,880 | 18.9% | +$1,470 | +1.8 | 24.0% | $95.10 | 1,933 |
| Central District | $30,470 | 21.5% | +$2,080 | -2.7 | 23.6% | $96.80 | 2,265 |
This is the work.
Not these three tools specifically. Sometimes your team learns to build the version that fits your operation, sometimes we work it out on a call, sometimes I build it. Always on tools you already pay for.
See what the workshop covers, or take the free check and find out which of your hours is worth attacking first.